
Figure 2.
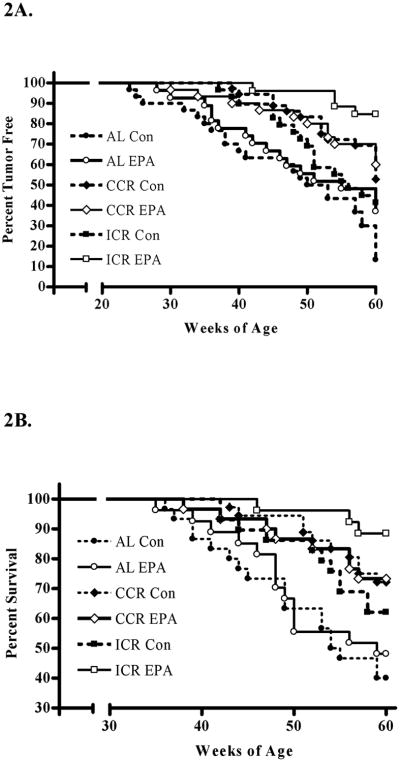
Disease free and survival curves of MMTV-Her2/neu mice in response to dietary interventions. Mice were either fed AL, CCR or ICR using diets with 10.1% fat calories from soy oil (Con) or with 2.85% fat from soy oil and 7.25% fat from eicosapentaenoic acid (EPA). A) Tumor formation was determined by palpation of a 7mm tumor. Percentage of tumor free mice is shown along the y-axis and the age of the mice is shown along the x-axis. B) Percent of surviving mice is shown along the y-axis and age of the mice is shown along the x-axis. Termination was determined by mammary tumor size or associated endpoints.