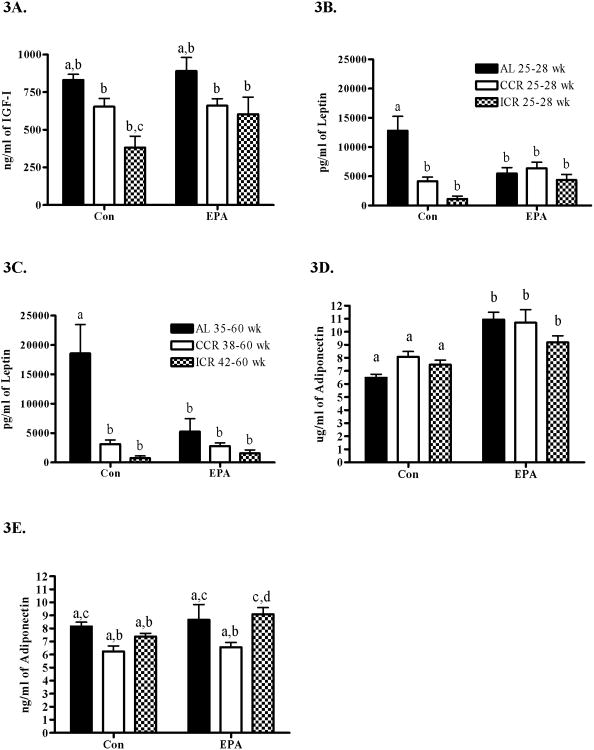
Figure 3.
Serum growth factors and adipokines in relationship to calorie restriction and dietary fat. The AL fed animals are shown with filled bars. The CCR fed animals are shown with open bars and the ICR fed animals are shown with checked bars. A) IGF-I was measured in serum obtained at euthanasia and analyzed in duplicate by ELISA from 6-7 mice per group. B) Leptin was obtained midstudy (25-28 weeks of age) or C) at the terminal endpoint which was determined by mammary tumor size or associated endpoints. Serum was analyzed for leptin by ELISA in duplicate from 6-12 mice per group. D) Adiponectin from serum obtained midstudy (25-28 weeks of age) or E) at the terminal endpoint which was determined by mammary tumor size or associated endpoints. Serum was analyzed for adiponectin by ELISA in duplicate from 6-12 mice per group. The diets are shown at the bottom of each graph and the calorie restriction protocol is identified in the legend to the right of the graph. Bars represent standard error of the mean and letters above the bars show significant differences.

