
Figure 1.
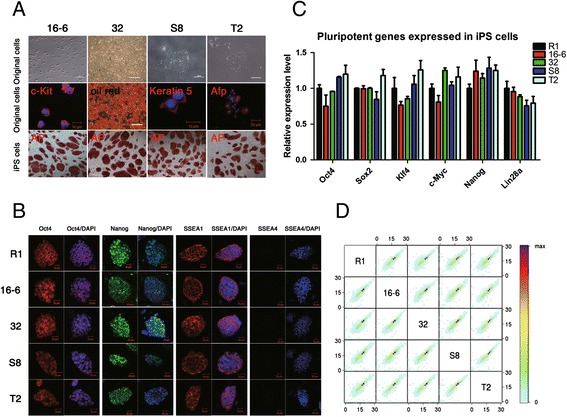
Pluripotency and global gene expression profiles of mouse secondary iPSCs. A) Morphology and tissue specificity of the three germ layer somatic cells before reprogramming and positive alkaline phosphatase staining after reprogramming. B) Immunofluorescent staining demonstrated that the R1 ESC and iPSC lines were positive for Oct4, Nanog and SSEA1 expression, but negative for SSEA4 expression. Scale bars, 20 μm. C) qPCR results revealed no difference in the expression levels of key pluripotency factors between the ESC R1 and the iPSC lines. D) The transcriptomes of the ESC R1 and four iPSC lines were highly correlated pairwise (Spearman R-values ≥0.95). The color bar shows the gene number in each comparison. The RNA-seq data were highly reproducible [see Additional file 1: Figure S1]. Secondary iPS cell lines 16-6, 32, S8 and T2 were derived from mesodermal hematopoietic cells, adipocyte progenitor cells, ectodermal epidermal cells and endodermal stomach lining cells from the all-iPSC mice, respectively. ESC, embryonic stem cells; iPSCs, induced pluripotent stem cells.