Figure 2.

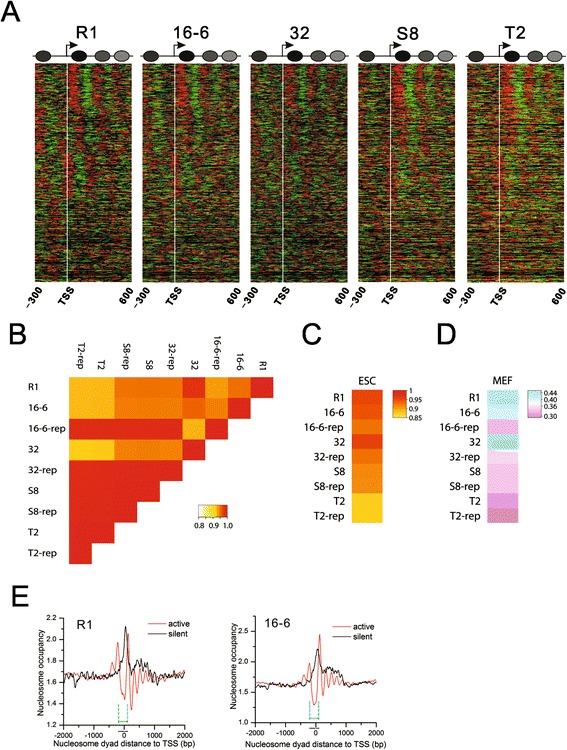
Similar chromatin landscapes shared by mouse ESCs and iPSCs. A) Normalized nucleosome occupancy pattern around the TSSs (indicated by white vertical line). Red represents reads (49 bp) on the sense strand. Green represents reads on the antisense strand. The adjacent red and green reads form a nucleosome. A schematic diagram that shows the canonical arrangement of -1, NDR, +1, +2, +3 nucleosomes around the TSSs was summarized from all the transcripts. B) We scanned the genome with a 10 kb window and calculated the normalized nucleosome occupancy for each window. Nucleosome occupancy across the genome between ESC R1 and the four iPSC lines shows an extremely high level of similarity (Spearman R-values ≥0.9). Heatmaps in Additional file 3: Figure S2B show the detailed nucleosome occupancy changes in each chromosome between the two cell lines. The high correlation between the iPS cell lines and their biological replicates indicates the high reproducibility. C) Global nucleosome occupancy is highly similar between the iPSCs and ESCs (Spearman R-values >0.8). D) Global nucleosome occupancy is significantly different between the stem cells and MEFs (Spearman R-values ≤0.4). E) Canonical nucleosome organization around the TSS is required for gene activation. Genes with zero read count were defined as silent genes, whereas the rest were considered active genes. There is a -1, NDR, +1, +2, +3 and so on canonical nucleosome arrangement around the TSSs of active genes. In contrast, the TSSs of silent genes were protected by one prominent nucleosome. The cyan lines indicate the region (-200 bp to approximately +100 bp of TSS) with distinct nucleosome distribution patterns between active and silent genes that are conserved in all the pluripotent stem cell lines. ESCs, embryonic stem cells; iPSCs, induced pluripotent stem cells; MEFs, mouse embryonic fibroblasts; NDR, nucleosome depletion region; TSSs, transcriptional start sites.
