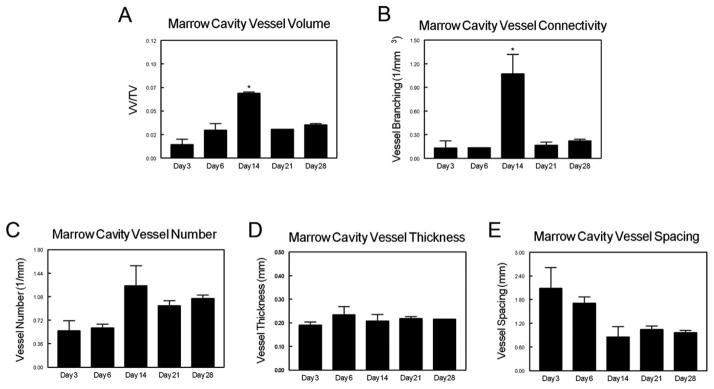
FIGURE 2.

Time course of neo-vascularization following tibial marrow ablation. At days 3, 6, 14, 21, and 28 post-ablation, rats were perfused-fixed with Microfil (Flow-Tech, Carver, MA) and imaged using μCT. (A) Marrow cavity vessel volume fraction, (B) vessel connectivity, (C) vessel number, (D) vessel thickness, and (E) vessel spacing were quantitatively assessed. Data are presented as the mean ± SEM of three animals for each time point. *p < 0.05 versus all other time points.
