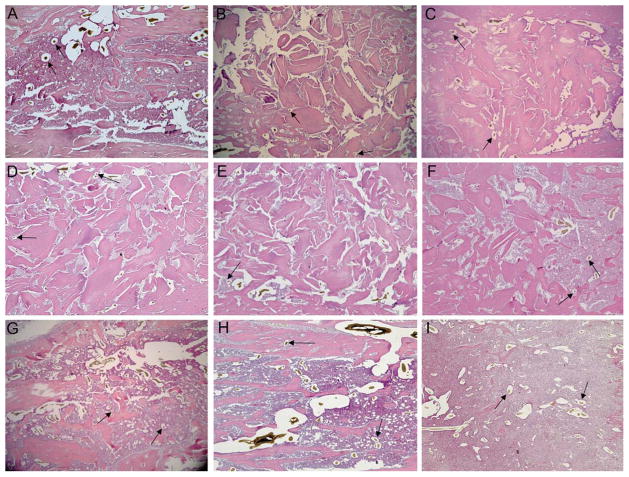
FIGURE 6.
Representative histological sections of ablated tibias. Following μCT imaging, ablated tibias were embedded in paraffin and processed for histology. Sections were stained with haematoxylin and eosin. Arrows indicate the presence of vascular structures containing Microfil. Groups analyzed were (A) empty defect, (B) Inactive + NaHY, (C) Active + Saline, (D) High MW NaHY + 31% DBM, (E) Low MW NaHY + 31% DBM, (F) High + Low MW NaHY + 31% DBM, (G) High MW NaHY, (H) Low MW NaHY, and (I) High + Low MW NaHY.

