
Figure 1.
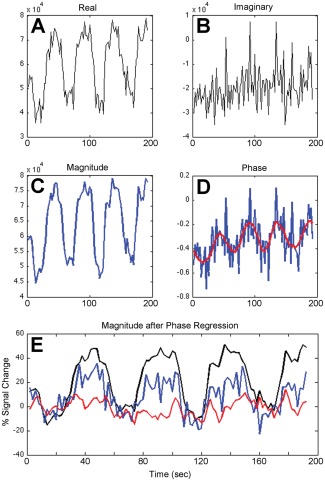
Time series for a single voxel containing a vein. The (A) real and (B) imaginary time series add in quadrature to form the (C) magnitude. In (D) the blue curve is the noisy, unfiltered phase time series and the red curve is this phase time series after SGF. In (E), the magnitude curve before PR exhibits a 38.8% signal change relative to baseline. The blue curve is the magnitude after PR using the unfiltered time series; the BOLD signal change is partially suppressed, but still exhibits a 16.8% signal change. Finally, the red curve is the magnitude after Savitzky‐Golay filtered PR and exhibits complete suppression with a −0.55% BOLD signal change.