
Figure 3.
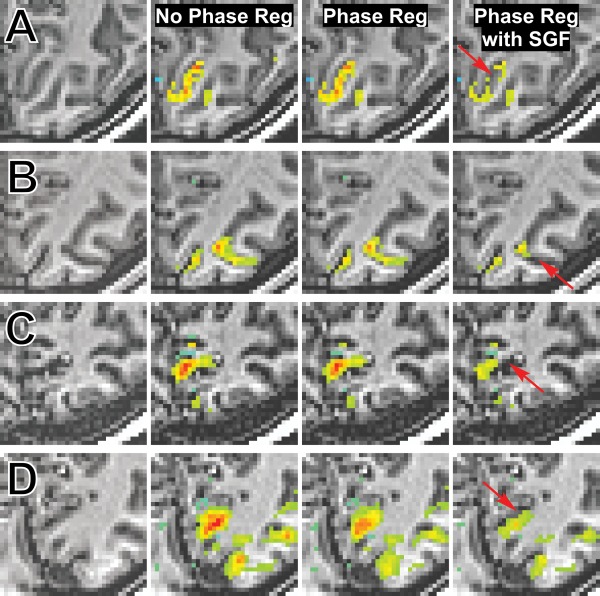
Statistical parametric maps for four subjects constructed from data acquired with (A) high‐resolution EPI (t > 5), (B) FFE (t > 4), (C) lower resolution EPI (t > 5), and (D) PRESTO (t > 6). The far left column displays the underlying anatomy and the adjacent columns present activation maps without PR, after standard PR, and after PR with SGF. Arrows identify regions that are only partially suppressed after PR but completely suppressed after PR with SGF.