
Figure 1.
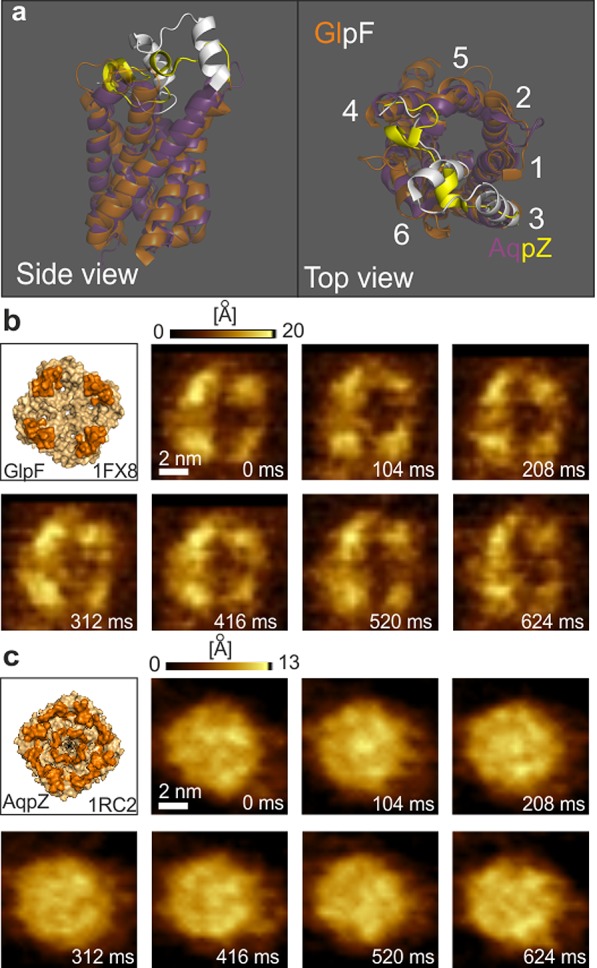
Structural homology and high speed AFM imaging of Glpf and AqpZ. (a) Structural alignment of GlpF (PDB 1FX8,20 orange) and AqpZ (PDB 1RC2,21 purple). The periplasmic loops are colored in white (GlpF) and yellow (AqpZ). Alignment was done using PyMol.28 (b) GlpF surface representation with the membrane protruding periplasmic loops colored in orange and HS-AFM time series of a single GlpF tetramer embedded in a supported lipid bilayer. (c) AqpZ surface representation with the membrane protruding periplasmic loops colored in orange and HS-AFM time series of a single AqpZ tetramer embedded in a supported lipid bilayer.