
Figure 2.
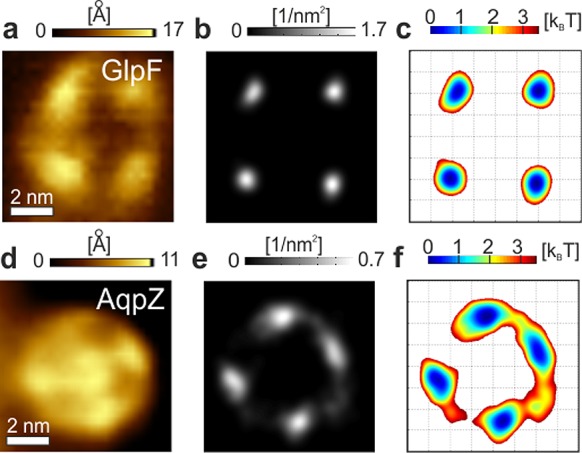
Configuration space and energy landscape underlying loop motions. (a) Average GlpF topography obtained from a time series (n = 37) of subsequent HS-AFM images. (b) Position probability map of GlpFs main periplasmic loop. (c) Energy landscape underlying the thermal motion of GlpFs main periplasmic loop calculated from the position probability map (b) by eq 2. (d) Average AqpZ topography generated from a time series (n = 85) of subsequent HS-AFM images. (e) Position probability map of AqpZs main periplasmic loop. (f) Energy landscape underlying the thermal motion of AqpZs main periplasmic loop calculated from the position probability map (e) by eq 2.