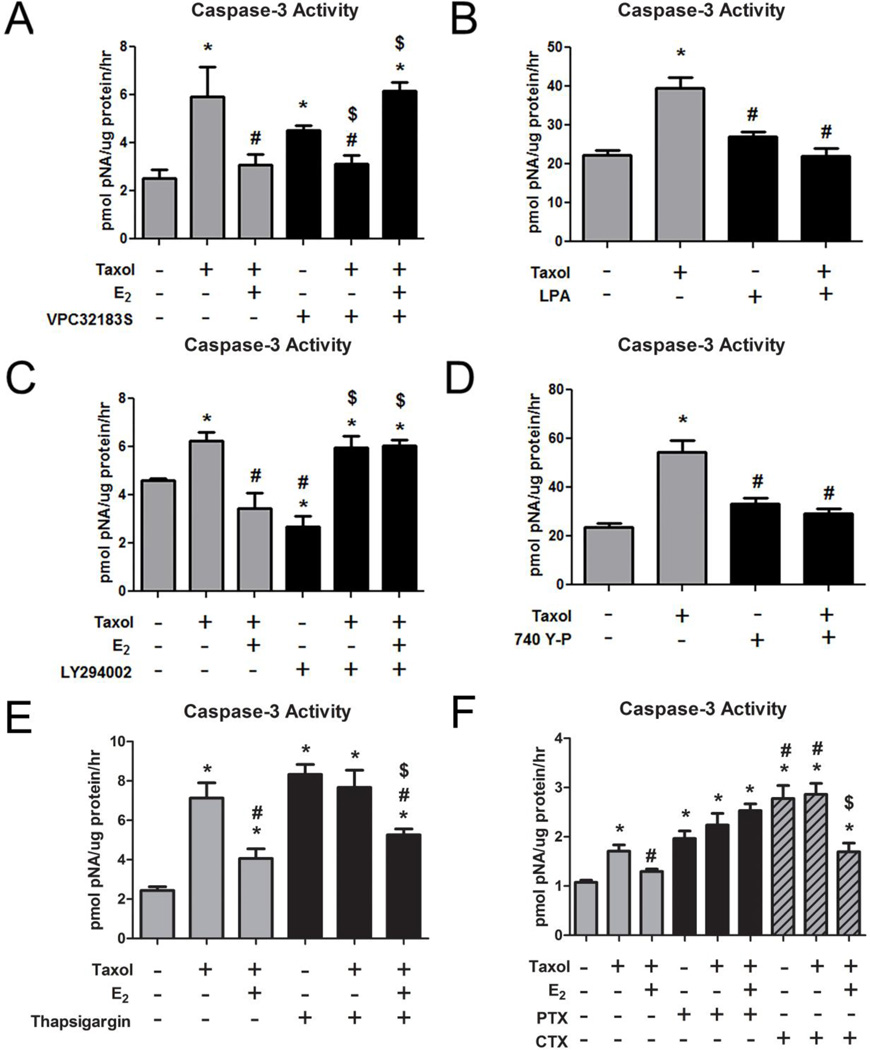
FIGURE 5. Role of LPA, PI3K, Ca++, and G-protein Signaling in the Anti-apoptotic Effect of E2 in HCC38 Cells.
(A) Taxol-induced (20μM) caspase-3 activity is reduced by 10−8M E2, while the LPAR1/3 antagonist, VPC32183S, does not allow E2 to block the effect of taxol. * represents p<0.05 compared to the untreated control group while # represents p<0.05 compared to 20μM taxol and $ represents p<0.05 compared to inhibitor alone. (B) Taxol-induced (20μM) caspase-3 activity is reduced by LPA. * represents p<0.05 compared to the untreated control group while # represents p<0.05 compared to 20μM taxol. (C) Taxol-induced (20μM) caspase-3 activity is reduced by 10−8M E2, while the LY294002 does not allow E2 to block the effect of taxol. * represents p<0.05 compared to the untreated control group while # represents p<0.05 compared to 20μM taxol and $ represents p<0.05 compared to inhibitor alone. (D) Taxolinduced (20μM) caspase-3 activity is reduced by the PI3K activator 740 Y-P. (E) Taxol-induced (20μM) caspase-3 activity is reduced by 10−8M E2, while thapsigargin enhances caspase-3 activity alone and this is also reduced by E2. (F) Taxol-induced (20μM) caspase-3 activity is reduced by 10−8M E2, while pertussis toxin and cholera toxin both enhance caspase-3 activity alone. The effect of CTX is reduced by E2. * represents p<0.05 compared to the untreated control group while # represents p<0.05 compared to 20μM taxol and $ represents p<0.05 compared to inhibitor alone.

