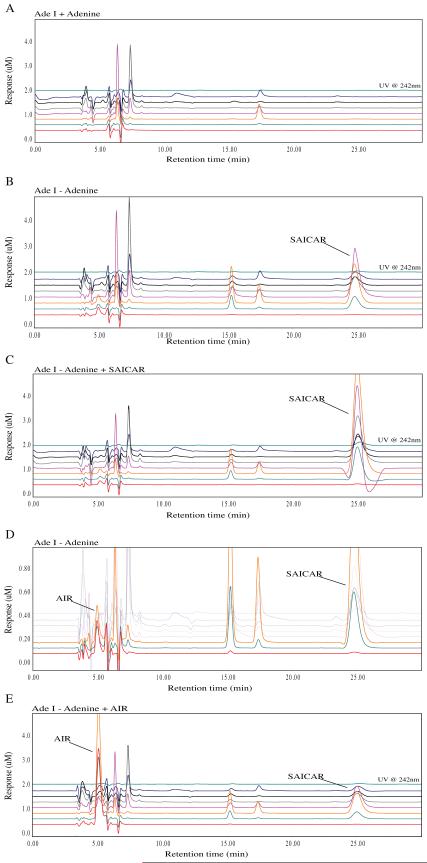
Figure 8.
Metabolomic analysis of the AdeI (ADSL) CHO cell starvation. The traces show the baseline profile of AdeI unstarved (A) and the accumulation of a peak at 25 minutes in the starved sample (B). This corresponds to a peak in the unstarved sample spiked with a SAICAR standard (C). Additionally, a small peak at 5 minutes reminiscent of AIR accumulated in small concentrations in the AdeI starved samples. This suggests that accumulation of SAICAR may inhibit the function of PAICS resulting in AIR accumulation (D). This peak corresponds to AIR in starved AdeI cells spiked with AIR (E).

