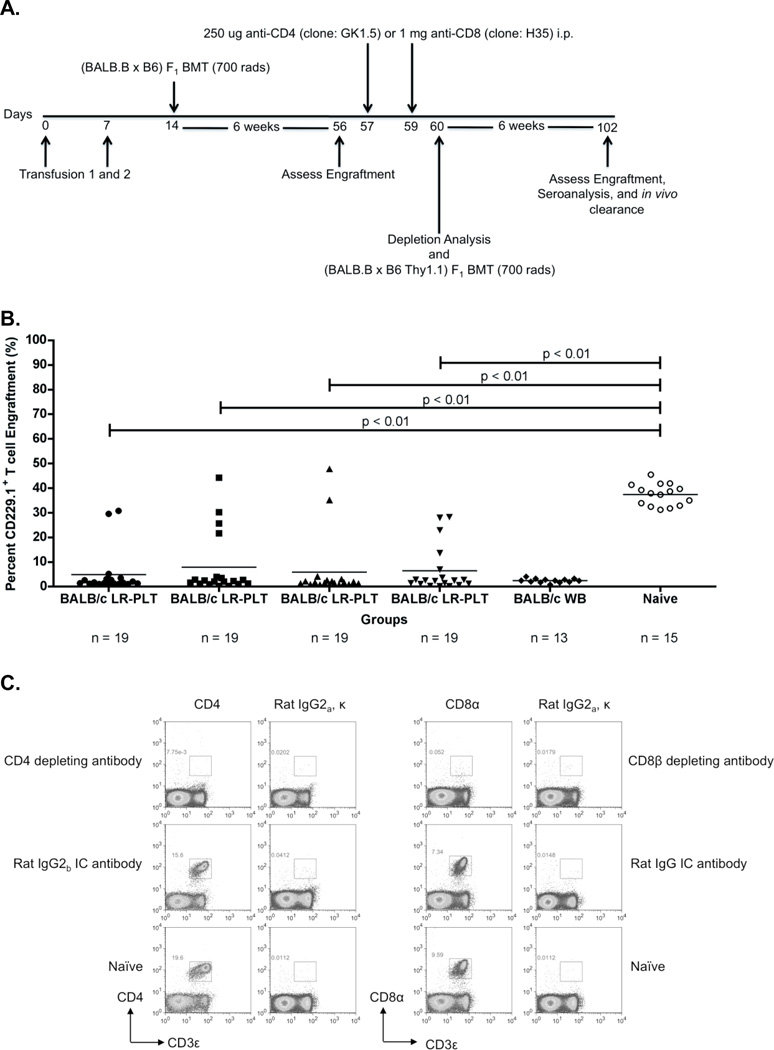
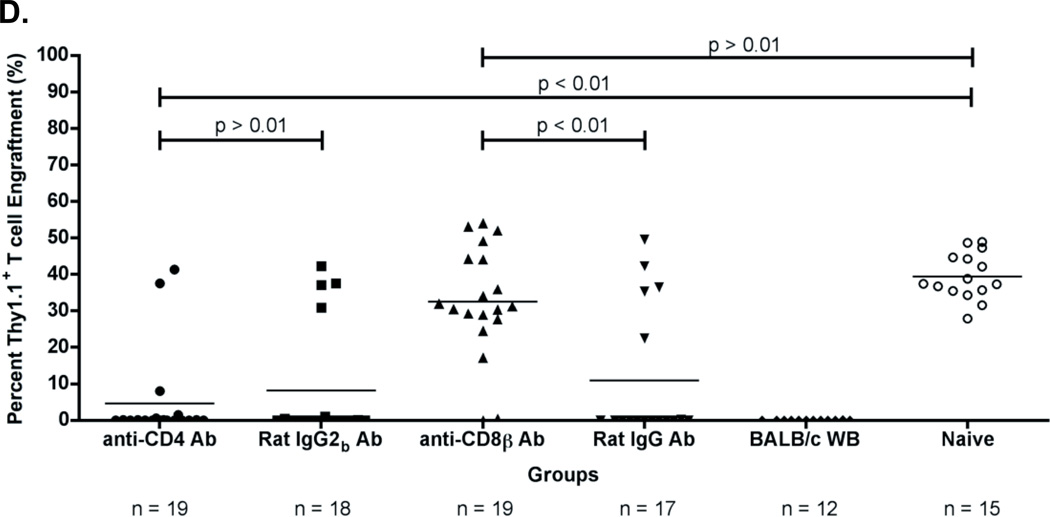
Figure 3. Rejection of a BALB.B BMT is mediated by a CD8+ cellular response that requires the presence of CD4+ cells prior to BMT.
(A) Experimental model testing the requirement of CD4+ and CD8+ T cells as the rejection vectors. Using the depletion model described in Figure 1A, BALB/c platelet donors were MHC- and mHA-mismatched, whereas (BALB.B x C57BL/6J) and (BALB.B x B6 Thy1.1) F1 BM donors were MHC-matched but mHA-haplomismatched. Recipients were transfused twice, a week apart. One week after the second transfusion, recipients received a (BALB.B x C57BL/6J) F1 BMT. Six weeks later, indicated recipients were treated i.p. with anti-CD4 or anti-CD8β depleting antibodies, or isotype control antibodies Rat IgG2b or Rat IgG, respectively. Depletion of CD4+ or CD8+ T cells was monitored in the peripheral blood. Recipients were then given a (BALB.B x B6 Thy1.1) F1 BMT. Seroanalysis and in vivo survival of BALB.B targets was performed after BMT (see figure 4). (B) (BALB.B x C57BL/6J) F1 BMT engraftment results. Engraftment was assessed in the peripheral blood of transplant recipients. BMT engraftment was measured as a percentage of CD229.1+ T cells two standard deviations above the rejecting BALB/c whole blood transfused recipients. All four BALB/c LR-PLT transfused recipients in (B) were treated the same. The BALB/c LR-PLT transfused recipients were split into the four treatment groups to compare engraftment during the first and second transplantation in panels (B) and (D), respectively. The symbol for each group in panel (B) corresponds with that in panel (D). (C) Analysis of CD4+ and CD8+ T cell depletion in re-transplant recipients. Peripheral blood leukocytes from recipients receiving the second BMT were stained for CD4+ or CD8+ T cells using anti-CD4 (clone: RM4-5) and anti-CD8α (clone: 53-6.7) antibodies. (D) Engraftment results for (BALB.B x B6 Thy1.1) F1 BMT recipients. Engraftment was defined as having a percentage of Thy1.1+ T cells two standard deviations above the mean of the rejecting recipients treated with the corresponding isotype control antibody. The mean of each group in (B) and (D) is represented as a horizontal line. Statistics were generated using column statistics and a one-way ANOVA with Dunnett’s post-test. Illustrated is the combined data from three independent experiments.


