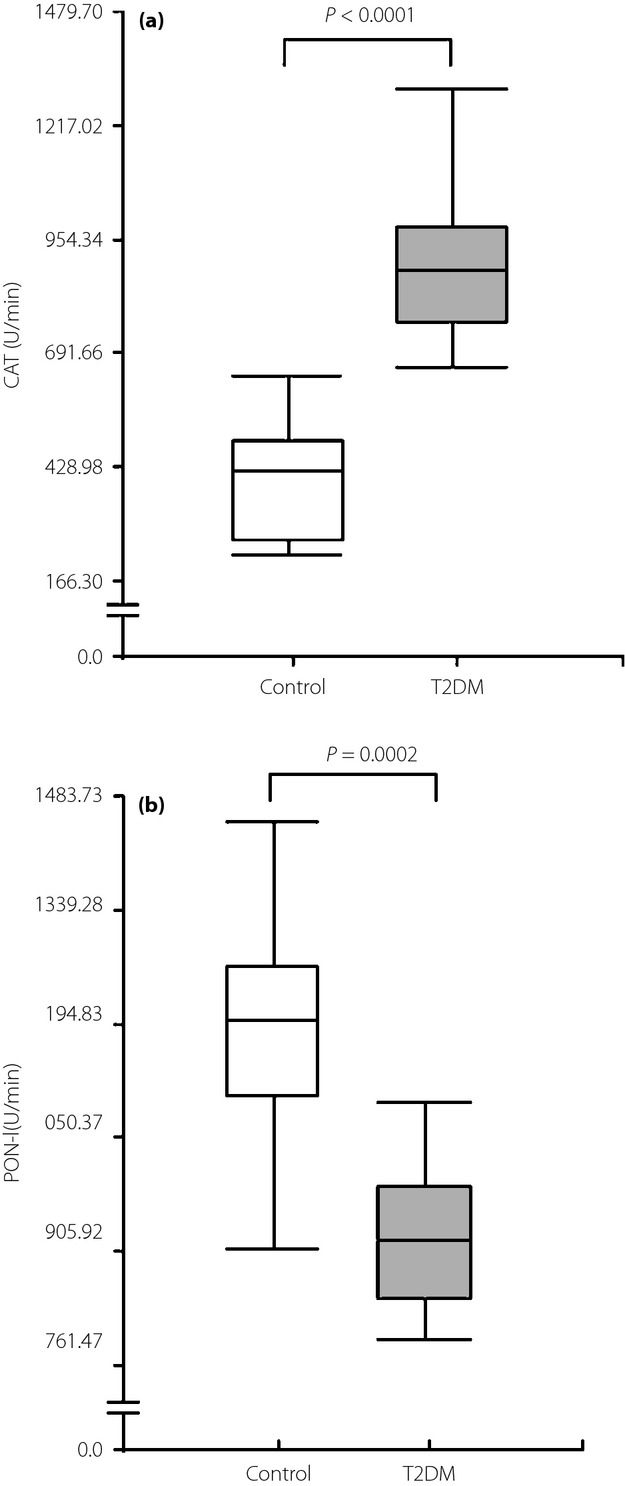
Figure 2.

Box plot graph data of (a) catalase (CAT) plasma activity and (b) paraoxonase-1 (PON-1) plasma activity. The boundary of the box closest to zero indicates the 25th percentile, the line within the box marks the median and the boundary of the box farthest from zero indicates the 75th percentile. T2DM, type 2 diabetes mellitus.
