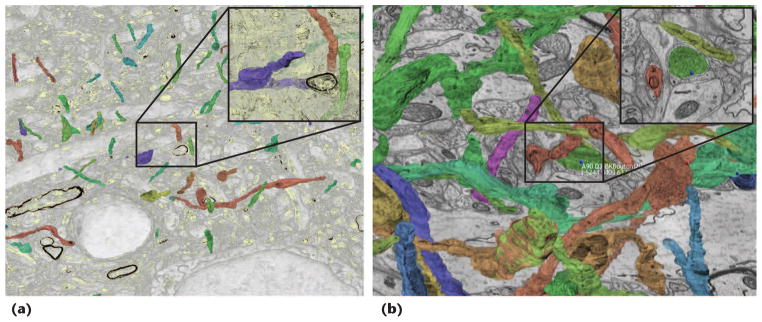
Figure 9.

Volume-rendering segmentation data and synapse labeling. The left and middle images show different zoom factors and transfer functions for volume-rendering segmentation data. The transparent transfer function in the middle image lets users visually follow otherwise occluded structures. The right image shows a labeled synapse in 3D and slice views. Users can automatically navigate to and zoom in on a synapse by selecting it in the 3D view. The view parameters and clipping planes adjust automatically.
