Figure 3.

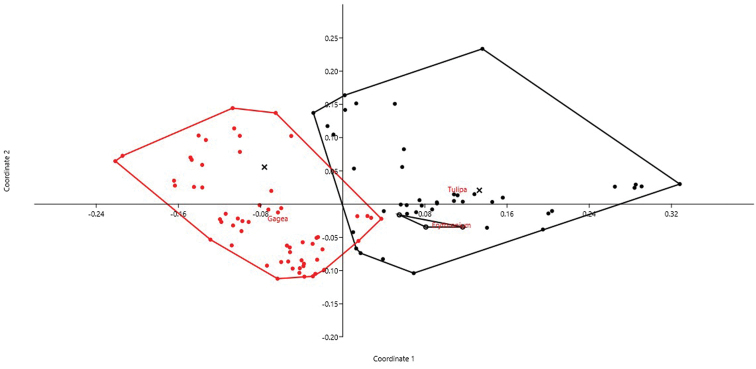
PCoA for Tulipeae genera based on 6 quantitative karyological parameters (Axis 1 vs. Axis 2). The two Amana accessions are represented by the “×” symbol.

PCoA for Tulipeae genera based on 6 quantitative karyological parameters (Axis 1 vs. Axis 2). The two Amana accessions are represented by the “×” symbol.