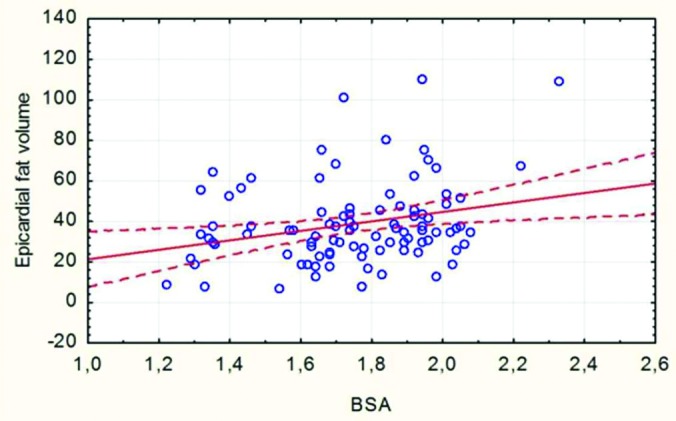
Figure 3. Correlation between BSA and VEAT (r =0.268, p=0.009). Scatter plot with a linear regression trend line depicting the relationship between EAT volume (cm3) and BSA. There was a minor correlation between the EAT volume and BSA (r =0.268, p=0.009).

