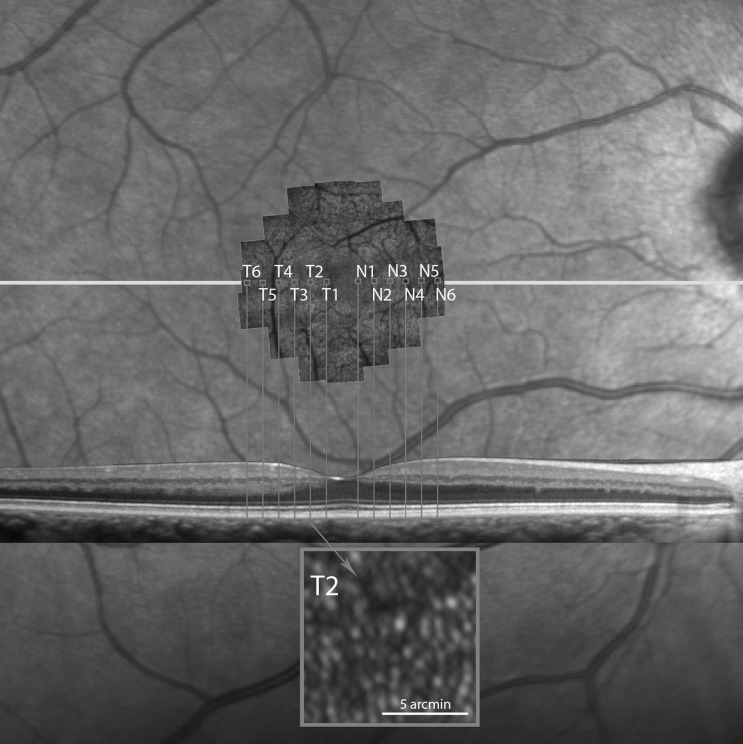
Figure 3.
The AOSLO montage aligned with the B-scan SD-OCT image and the near-infrared fundus image. The capital letters N (nasal) and T (temporal) show the selected retinal regions along the central horizontal meridian with the respective locations on the SD-OCT B-scan. The inset in gray shows a representative cone mosaic at location T2 in this normal eye.

