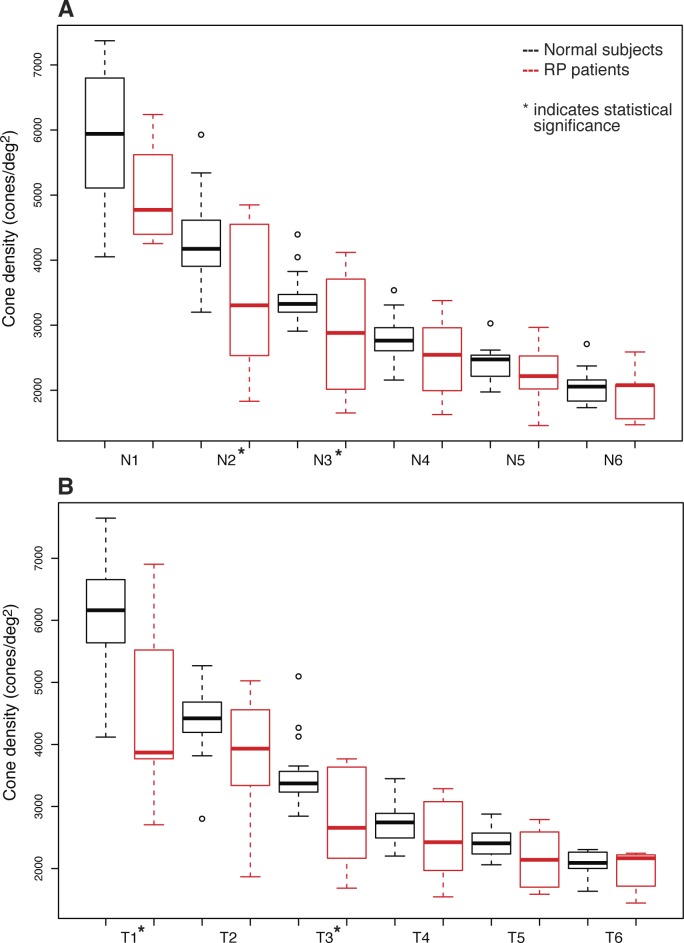
Figure 4.
Tukey box plot of the average cone densities in normal eyes and eyes with RP at each single retinal location. The band inside the box is the median. The bottom and top of the box represent the first and third quartile, the whiskers are within 1.5 interquartile range (IQR) of the lower and upper quartile. Any data not included between the whiskers is an outlier and is plotted with a small circle. (A) Shows nasal retinal locations, and (B) temporal retinal locations.

