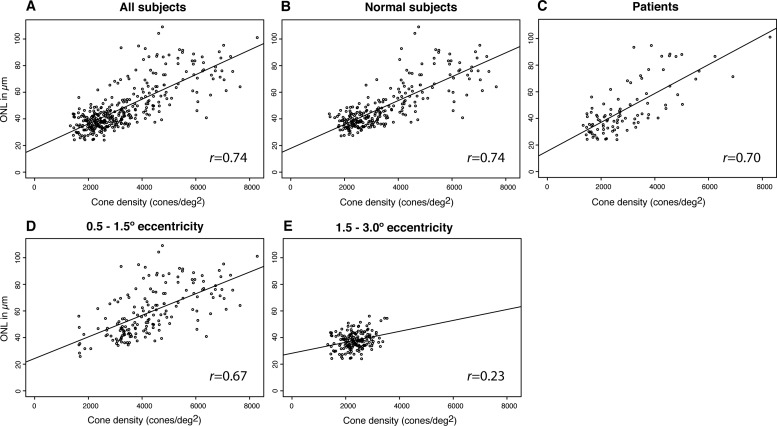
Figure 5.
Correlation between cone density and ONL thickness for all subjects ([A], Spearman's rank correlation coefficient [r] = 0.74; 95% CI, 0.67–0.82), normal subjects ([B], r = 0.74; 95% CI, 0.67–0.82), patients ([C], r = 0.70; 95% CI, 0.48–0.88) as well as for regions between 0.5° and 1.5° eccentricity ([D], r = 0.67; 95% CI, 0.55–0.81), and regions between 1.5° and 3° eccentricity ([E], r = 0.23; 95% CI, −0.06–0.48), only.

