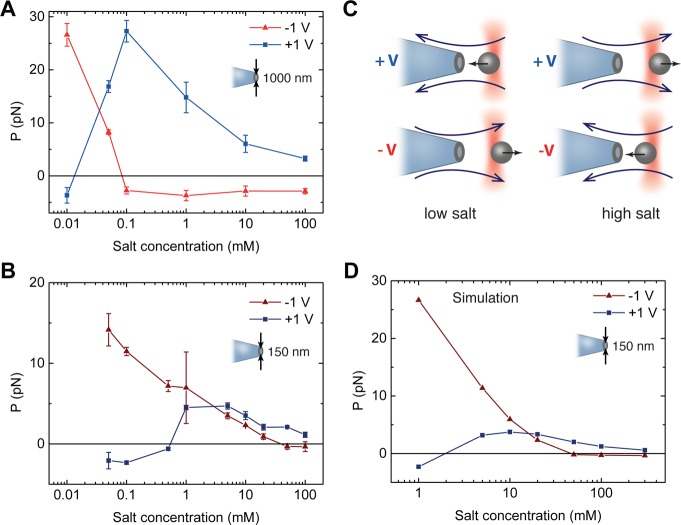
Figure 2.
Flow reversal as a function of salt concentration. (A) Experimentally measured values of P for applied voltages of +1 V (blue squares) and −1 V (red triangles) in a 1000 nm pore, as a function of salt concentration. As salt is reduced, P initially increases before dramatically reversing direction at a critical salt concentration. (B) In a 150 nm pore, the same behavior is observed, but with the crossover happening at a higher salt concentration. In both cases, there is an asymmetry in P with respect to voltage reversal. In all experiments, measurements were made with the bead positioned between 3 and 5 μm from the pore. (C) A cartoon summarizing the experimental results. (D) Finite-element simulations are able to reproduce the behavior for a 150 nm pore, exhibiting both flow reversal and flow rectification asymmetry. Results are also in agreement for the 15 and 1000 nm pores (Supplementary Figure S1).

