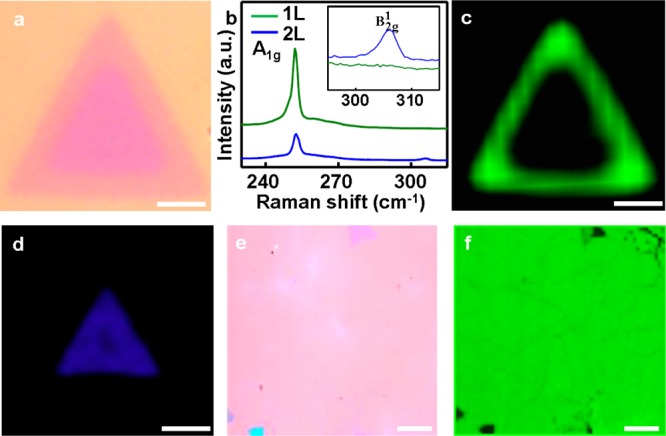
Figure 3.

Micro-Raman investigation of the monodomain WSe2. (a) Optical microscope image of a typical monolayer WSe2 with bilayer domain on the center. (b) The Raman spectra of the monolayer and bilayer WSe2. (c) and (d) Typical Raman map of the single domain monolayer (c, center wavenumber: ∼ 252 cm–1) with bilayer (d, center wavenumber: ∼ 307 cm–1) WSe2 domain. (e) Optical microscope image of large scale monolayer WSe2 with several bilayer or few-layer domain. (f) Raman map of the large scale monolayer (center wavenumber: ∼ 250 cm–1) WSe2 with several bilayer and few-layer domain. Scale bars of panels a, c, and d are all 5 μm; Scale bars of panels e and f are 10 μm.
