
Figure 4.
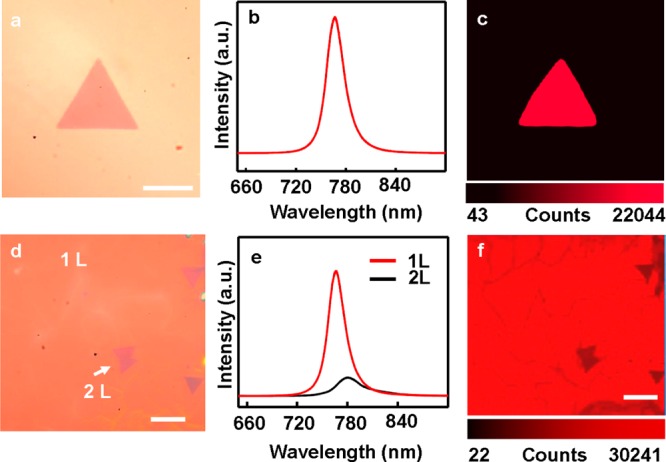
Optical properties of the single domain and fully covered WSe2 monolayers. (a) Optical microscope image of a typical monolayer WSe2. Scale bar is 5 μm. (b) PL spectra of the monolayer WSe2 and PL map (c) of WSe2 single domain showed in panel a. (d) Optical microscope image of the full covered monolayer WSe2 with some bilayer domains. Scale bar is 10 μm. (e) PL spectra of the monolayer and bilayer WSe2. (f) Corresponding PL map of the same region taken at panel d. Scale bar is 10 μm.