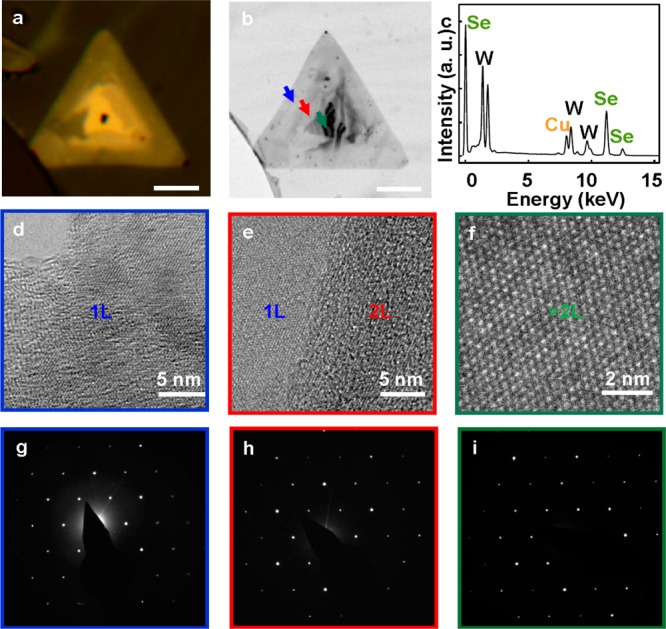
Figure 5.

Crystalline structure characterization. (a) Optical microscope image of a typical monolayer WSe2 with domain of few layers on the center. Scale bar is 10 μm. (b) Low magnification bright field TEM image of a typical transferred WSe2 triangular crystal. (c) Energy dispersive X-ray spectra showing the ratio between W and Se obtained from the integrated peak area is approximately 1:2. (d–f) HRTEM images of the atomic structure of the WSe2 monolayer (d), bilayer (e), and multilayers. These images were taken on the regions indicated on panel b by the arrows with blue, red, and dark cyan colors, respectively. Scale bars are 5 nm (d,e) and 2 nm (f). (g–i) SAED pattern of the monolayer (g), bilayer (h) and few-layer (i) WSe2 with the zone axis of [0001], the 6-fold symmetry in the position of the diffraction spots demonstrates that the triangular monolayer is predominantly single crystal with hexagonal structures.
