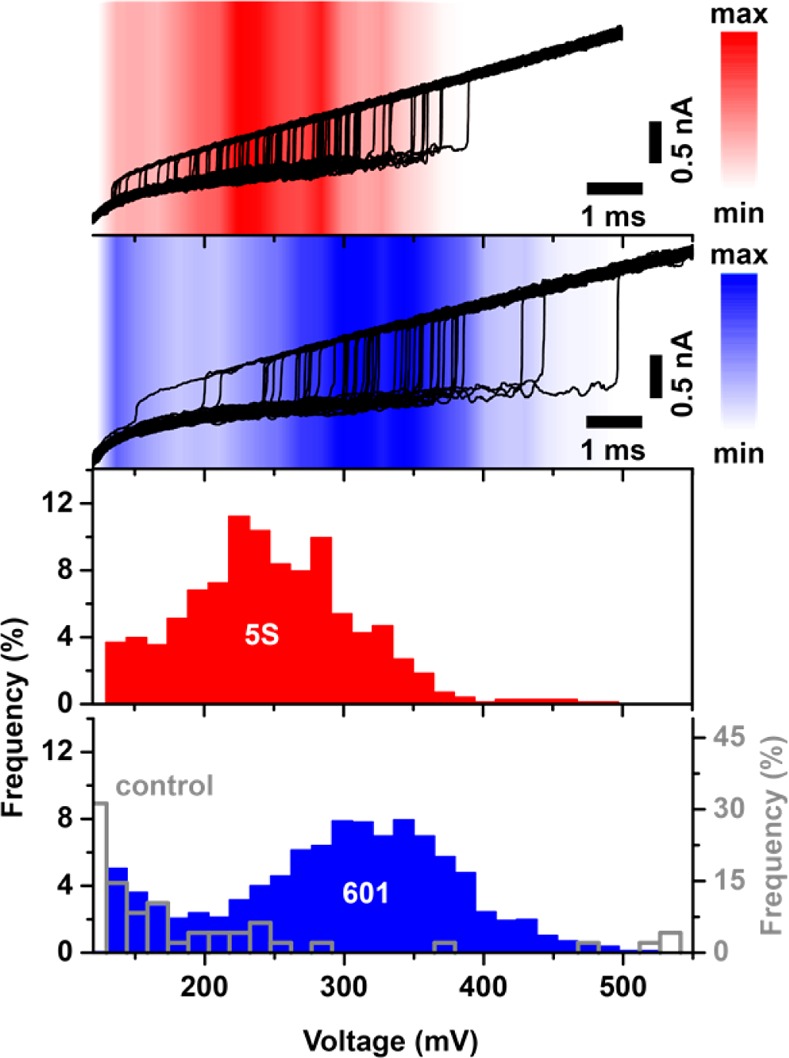
Figure 3.

Impact of the positioning sequence on unraveling characteristics. Top: Current traces acquired during triggered potential ramps in the presence of nucleosomes assembled from the sea urchin 5S (red) and the Widom 601 sequence (blue) (subsets of 50 representative traces with an opening transition, 40 V/s loading rate). Color shading: Distribution of opening transitions for the complete data sets (703 and 1547 detected transitions for 5S and 601, respectively). Bottom: Corresponding transition voltage histograms for 5S nucleosomes (red), 601 nucleosomes (blue), and a 250 bp DNA only control (open gray bars).
