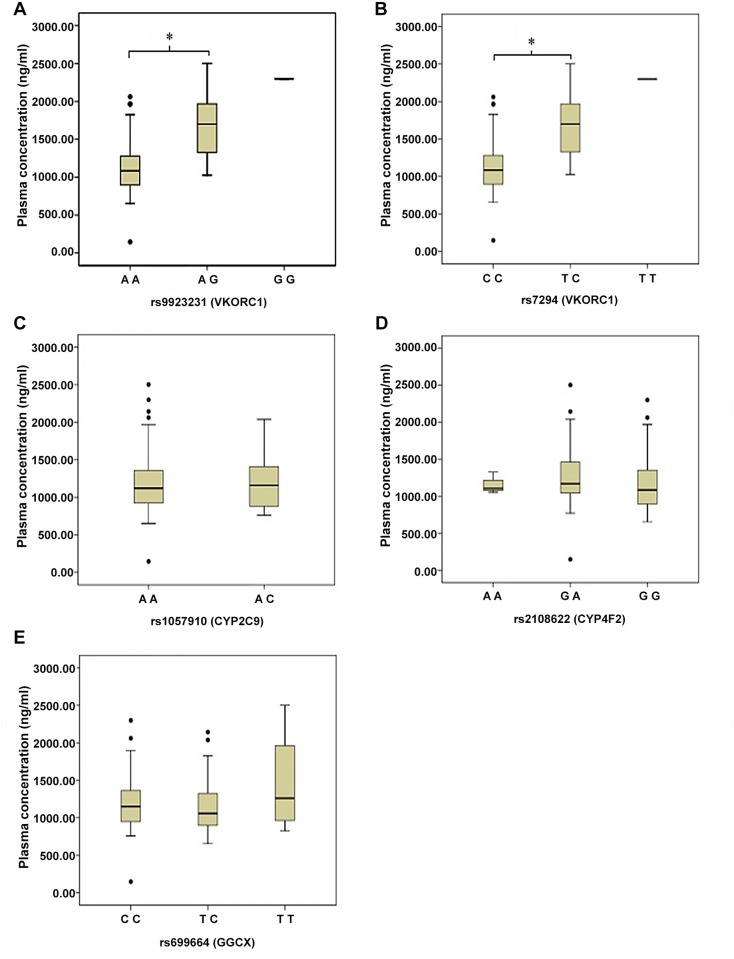
Figure 2. Relation between the plasma concentration and the tested genes.
Panel A—E: rs9923231 (Panel A), rs7294 (Panel B), rs1057910 (Panel C), rs2108622 (Panel D), rs699664 (Panel E). Each box indicates 25 to 75 percentile of values, and the horizontal lines represent the median value of plasma concentration. *: p < 0.05 at ANOVA test.

