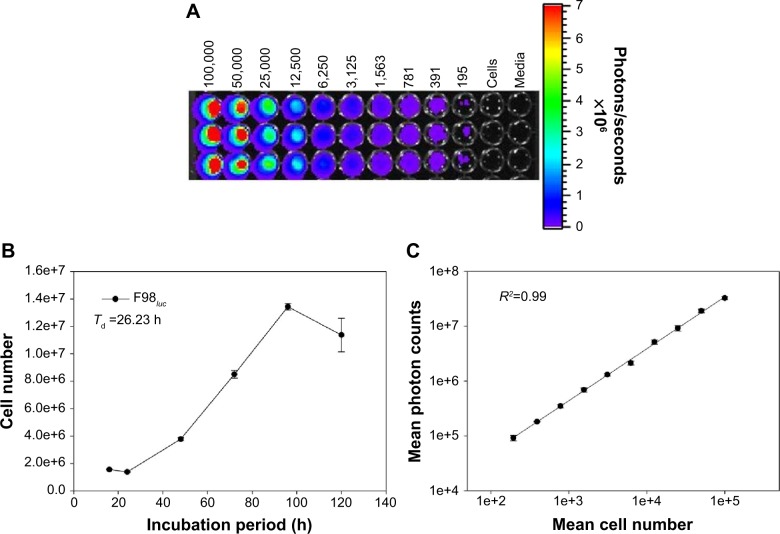
Figure 1.
Relationship between F98luc cell number and bioluminescent intensity (n=3).
Notes: (A) In vitro monitoring of bioluminescence of F98luc cells via BLI. (B) In vitro cell growth curve of F98luc cells. (C) Linear correlation between mean cell number and mean bioluminescent intensity (R2=0.99).
Abbreviations: BLI, bioluminescent imaging; Td, doubling time; h, hours.

