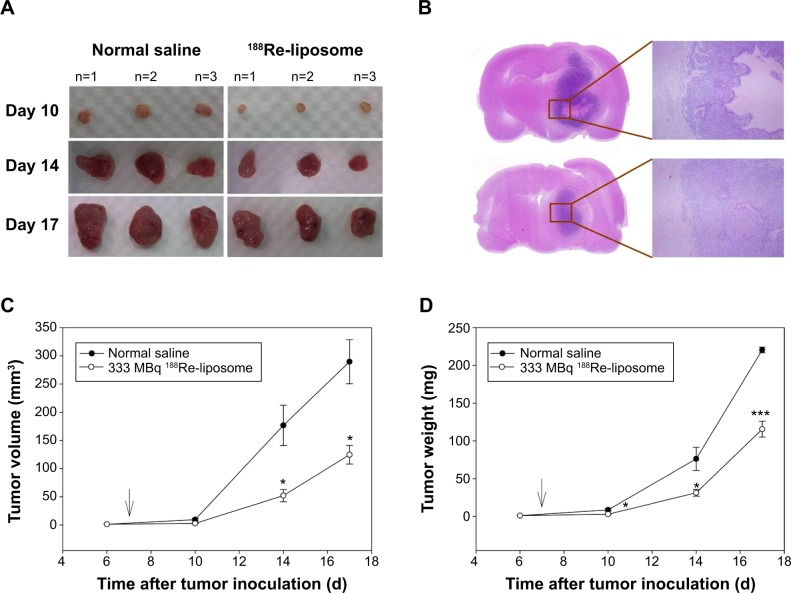
Figure 5.
Tumor growth inhibition monitoring at Day 10, 14, and 17 after treatment with normal saline and 188Re-liposome, respectively (n=3).
Notes: (A) Photograph of excised tumor masses after treatment with normal saline (left) and 188Re-liposome (right). (B) Histological examination of H and E staining for tumor parenchyma at Day 14 post-treatment with normal saline (upper) and 188Re-liposome (bottom). (C) Tumor volume (mm3) growth curve after treatment with normal saline (•) and 188Re-liposome (○). (D) Tumor weight (mg) growth curve after treatment with normal saline (•) and 188Re-liposome (○). * and *** indicating the significant differences with P<0.05 and P<0.001 between treated group and control group, respectively.
Abbreviations: d, days; H and E, hematoxylin and eosin.

