
Figure 2.
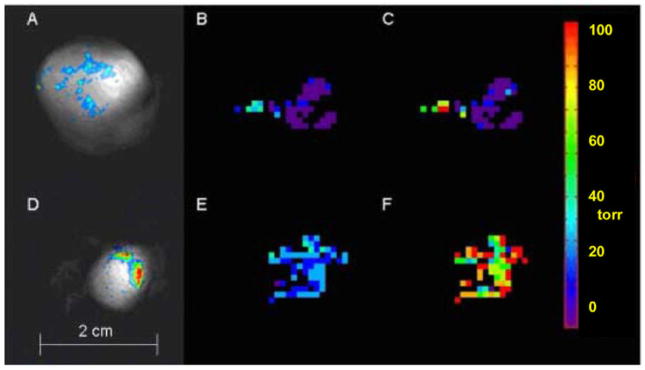
FREDOM determined pO2 maps of two representative AT1 tumors in rats. The pO2 value was calculated pixel-by-pixel based on the quantified 19F R1 and a priori calibrated 19F R1 - pO2 curve of HFB. (A and D) Composite 19F (displayed in color) and 1H (displayed in grayscale) MR images show HFB distribution in a large tumor (A, 3.6 cm3) and a small tumor (D, 1 cm3). (B and E) Baseline pO2 maps show higher pO2 in the small tumor when both animals were breathing air. Mean pO2 of large and small tumors were 0.1 ± 1.8 torr and 25.4 ± 1.1 torr, respectively. (C and F) Tumor pO2 maps of same animals obtained at 24 minutes after oxygen breathing, mean pO2 of large and small tumors were 8.1 ± 4.5 torr and 90.6 ± 3.9 torr, respectively. Both values were significantly higher than that of baseline (p < 0.01). (From Bourke et al. [4].)