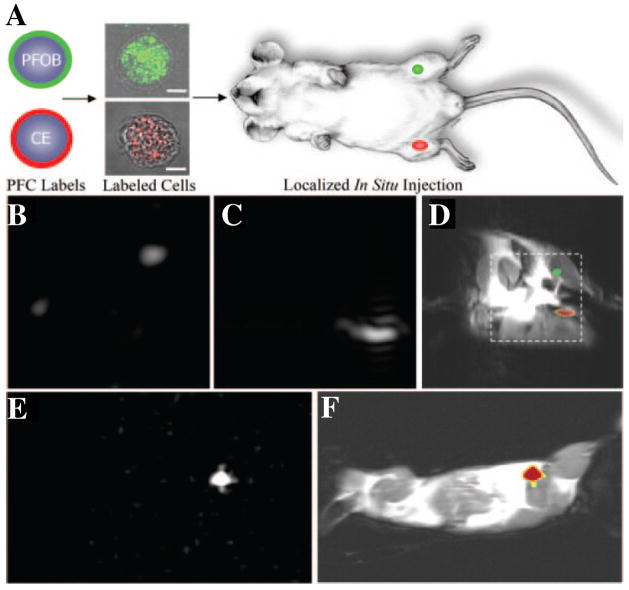
Figure 5.
Localization of PFC nanoparticles labeled cells in mice using 19F MRI. (A) 19F MRI trafficking of stem/progenitor cells labeled with either PFOB (green) or PFPE (red) nanoparticles. Labeled cells were locally injected into the skeletal muscle of mouse thigh before MRI. (B–D) At 11.7T field strength, 19F spectral discrimination permits respective imaging of ~1×10⁶ PFOB-loaded cells (B) and PFPE-loaded cells (C). The composite 19F (displayed in color) and 1H (displayed in grayscale) image (D) reveals the location of PFOB labeled cells in the left leg and PFPE labeled cells in the right leg (dashed line indicates 3×3 cm2 field of view for 19F images). (E) Similarly, a 19F image acquired at 1.5T field strength shows 19F signal from ~4×10⁶ PFPE nanoparticles labeled cells. (F) The composite 19F and 1H image shows the location of PFPE nanoparticles labeled cells in a mouse thigh. Overall, the absence of background signal in 19F images (B, C, and E) enables unambiguous localization of PFC-containing cells at both 1.5 T and 11.7 T field strength. (From Partlow et al. [3].)

