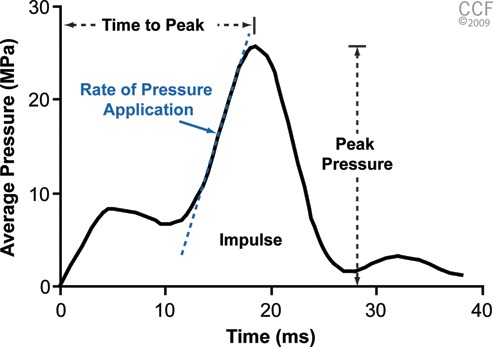
Figure 2.

Typical profile showing the impact of a 25-MPa impact specimen. Values obtained from the curve were time to peak, peak pressure, rate of pressure application, and impulse (area under the curve). Reprinted with permission, Cleveland Clinic Center for Medical Art & Photography © 2009-2010. All rights reserved.
