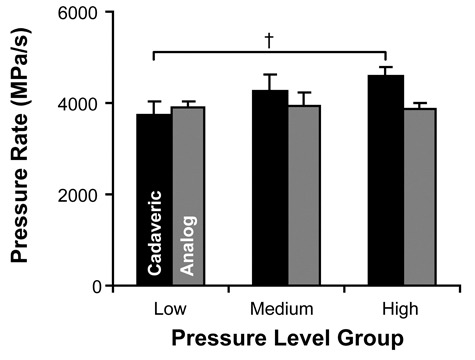
Figure 4.

Rate of pressure application (mean ± 95% confidence interval) for low-, medium-, and high-pressure groups. There were no statistically significant changes to the pressure rate except between the low- and high-pressure level groups of the cadaveric experiment (†P < 0.05).
