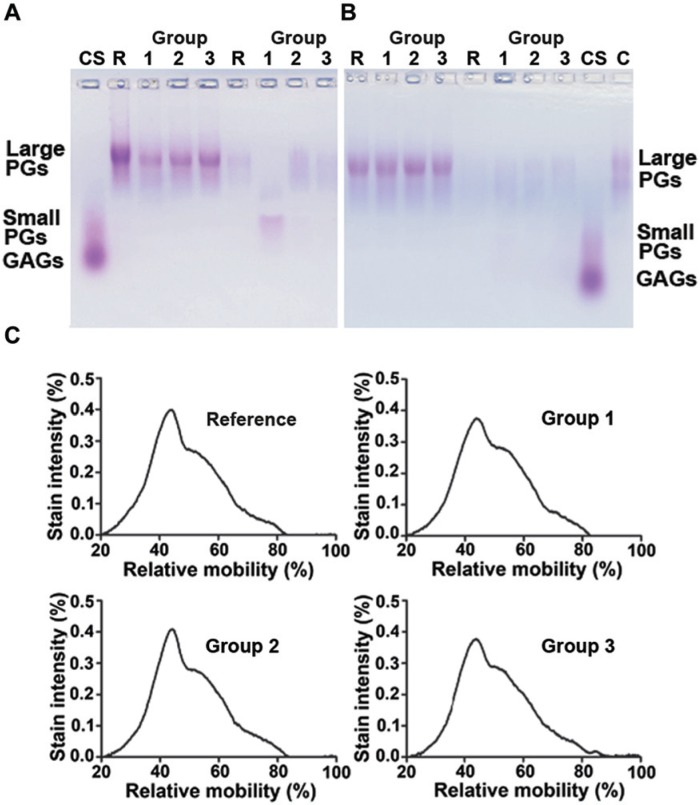
Figure 4.
Agarose gel electrophoresis of the extracted proteoglycans (PGs) shows the presence of the slowly migrating bands, representing the large PGs, and the faster the migrating smaller PGs (lanes 1-4). Sample sets from 2 different animals are shown in the subfigures (A) and (B). The diffused PGs (lanes 5-8) often revealed a fast mobility band in group 2, indicating that the PGs occasionally degraded in the absence of proteolysis inhibitors (A, lane 6). The representative densitometry plot profiles of the extracted PGs showed that the structures of PGs in groups 1 to 3 and reference group were comparable with each other (C). C = bovine native cartilage PGs; CS = chondroitin sulfate; lanes 2-4 = PGs from cartilage in groups 1 to 3; lanes 6-8 = PGs diffused into bathing solutions in groups 1 to 3; and lanes 1 and 5 are reference samples. Reference denotes reference group.

