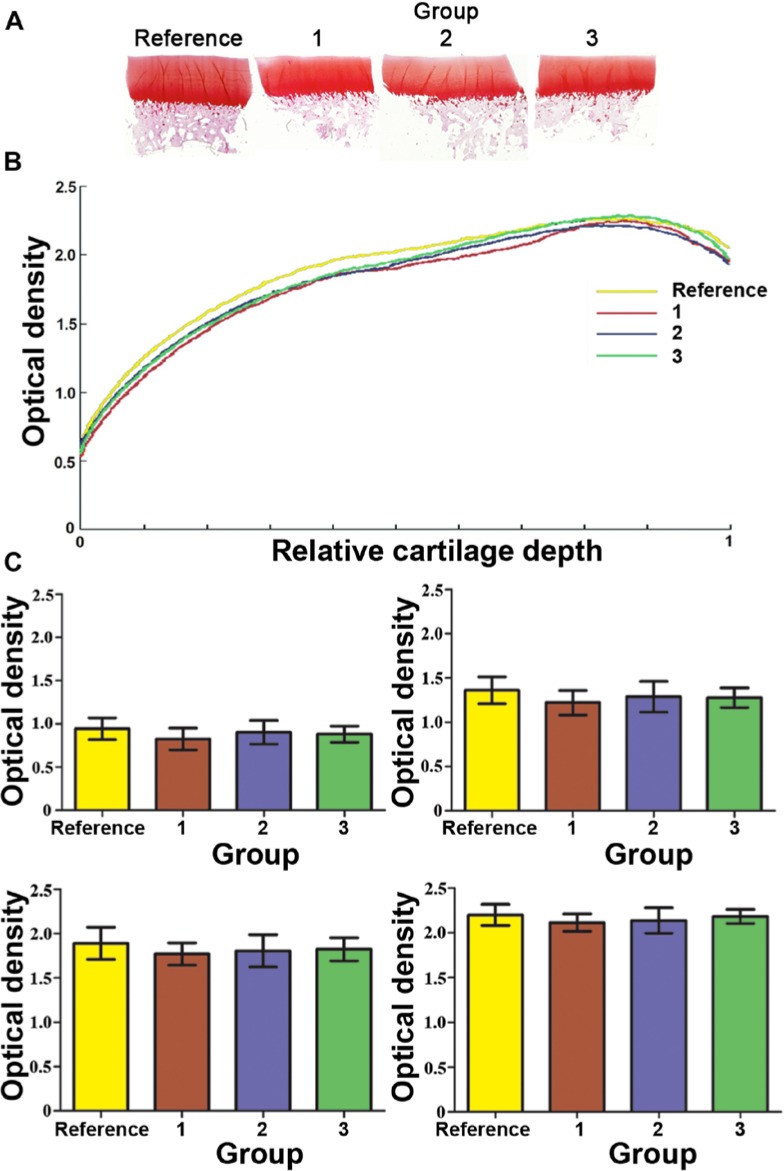
Figure 5.
Representative Safranin O stained histological sections (A) and the plots of optical density of Safranin O–stained histological sections, measured by means of the digital densitometry (B). Quantitatively, no obvious differences in Safranin O staining could be seen between any group. For the relative cartilage depth, “0” indicates the superficial cartilage and “1” the full depth in the deep zone. The control group had the highest PG content throughout the cartilage depth, whereas group 2 had the lowest one. The average values of the optical density were determined for the superficial, the intermediate, the middle, and the deep zones (mean ± 95% confidence intervals) (C). No significant differences could be found between the groups at any cartilage zone. Numbers 1 to 3 in A, B, and C represent groups 1 to 3, respectively, and Reference denotes the reference group (n = 15).

