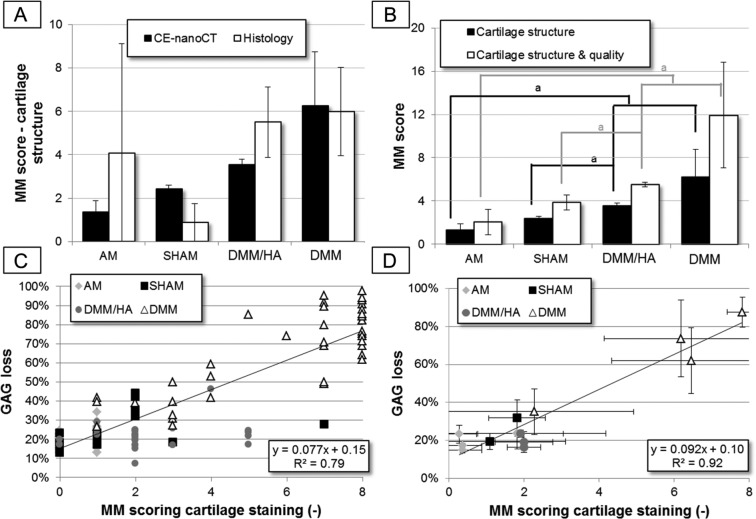
Figure 2.
(A) The modified Mankin (MM) scoring for the cartilage structure, determined on histological and contrast-enhanced nanofocus computed tomography (CE-nanoCT) sections for the different treatments groups. The animals used for the histological scoring (n = 3 or 4 per group) were not the same individuals that than the ones assessed by the CE-nanoCT scoring (n = 3 or 4 per group). (B) The MM scoring of 2-dimensional CE-nanoCT images. The score for the cartilage structure only and the sum for cartilage structure and quality are shown for the different treatments groups. (C) Correlation plot between the percentage of sGAG (anionic glycosaminoglycans) loss normalized to the growth plate cartilage and the MM scoring for the cartilage quality (as measured by Hexabrix staining intensity), both determined on the individual 2-dimensional sectional CE-nanoCT images throughout the different treatments groups and (D) the same correlation plot as (C) but the % sGAG loss and MM score were averaged over all scored sections of each animal (n = 10).

