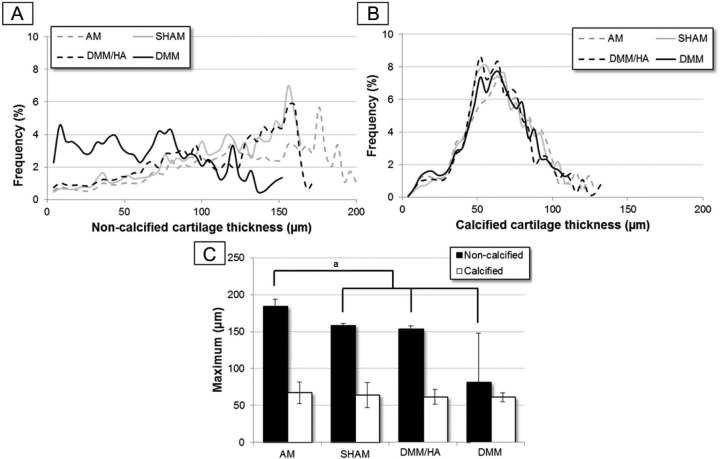
Figure 5.
The (A) noncalcified and (B) underlying calcified cartilage thickness distribution on the medial tibial plateau of the different treatments groups (n = 3 or 4). The data for the sham and DMM (destabilization of the medical meniscus) group have already been presented in Kerckhofs et al.20 (C) The “maximum of the thickness distribution” plot averaged per animal group (n = 3 or 4), both for the noncalcified and calcified cartilage layers (aP < 0.05 = significantly different).

