
Figure 6.
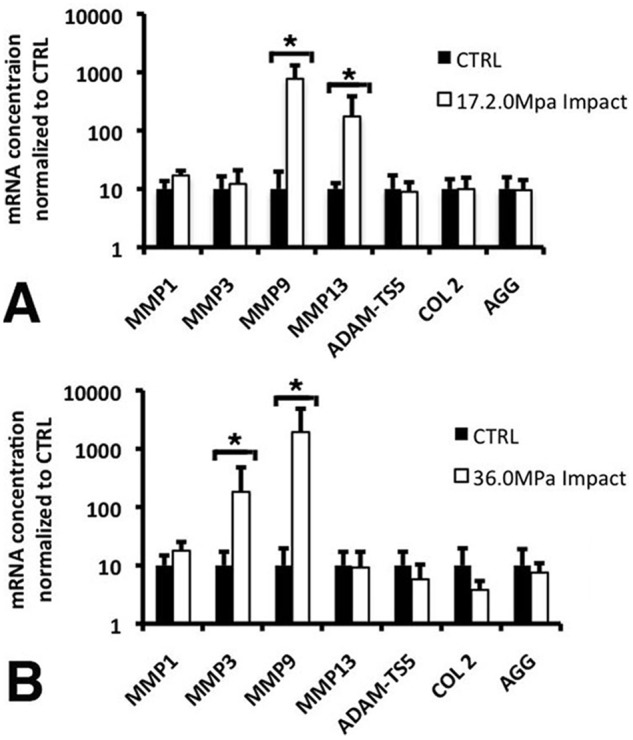
Expression of selected matrix components, MMPs, and aggrecanases detected by qRT-PCR in cartilage plugs 24 hours after being impacted at either (A) 36.1 ± 5.6 MPa or (B) 17.2 ± 1.6 MPa. Values are the mean ± SD of five samples per data point from two independent experiments normalized to GAPDH expression (*, P < 0.01).