
Figure 6.
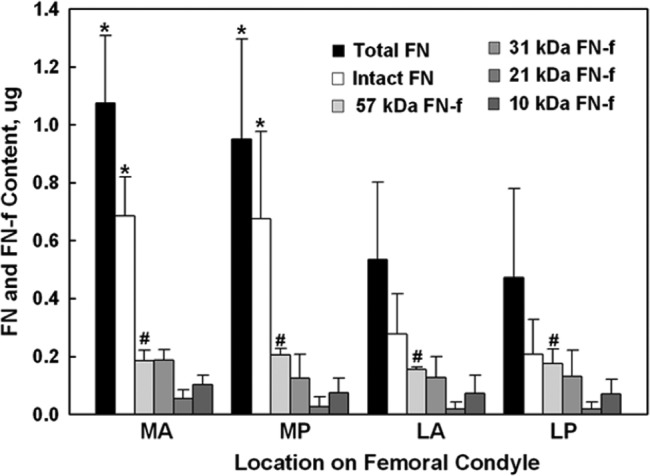
Fibronectin (FN) and fibronectin fragments (FN-fs) measured in the articular cartilage from 4 different load-bearing regions (Fig. 1) of bovine femoral condyles (N = 4 knees). Shown for each region (bars from left to right, respectively) is the amount (mean ± standard deviation; n = 8 samples) for the total FN (sum of FN and FN-fs), intact FN (~220 kDa), 57-kDa FN-f (one knee, n = 2 samples), 31-kDa FN-f, 21-kDa FN-f, and 10-kDa FN-f, quantified by Totallab TL100 densitometry (Nonlinear Dynamics, Durham, NC) relative to the control FN (220 kDa). Different regions are medial anterior (MA), medial posterior (MP), lateral anterior (LA), and lateral posterior (LP). There was no statistical difference between the MA and MP regions or the LA and LP regions. However, the medial side was significantly greater (*) than the lateral side but only for the total and intact FN amounts.