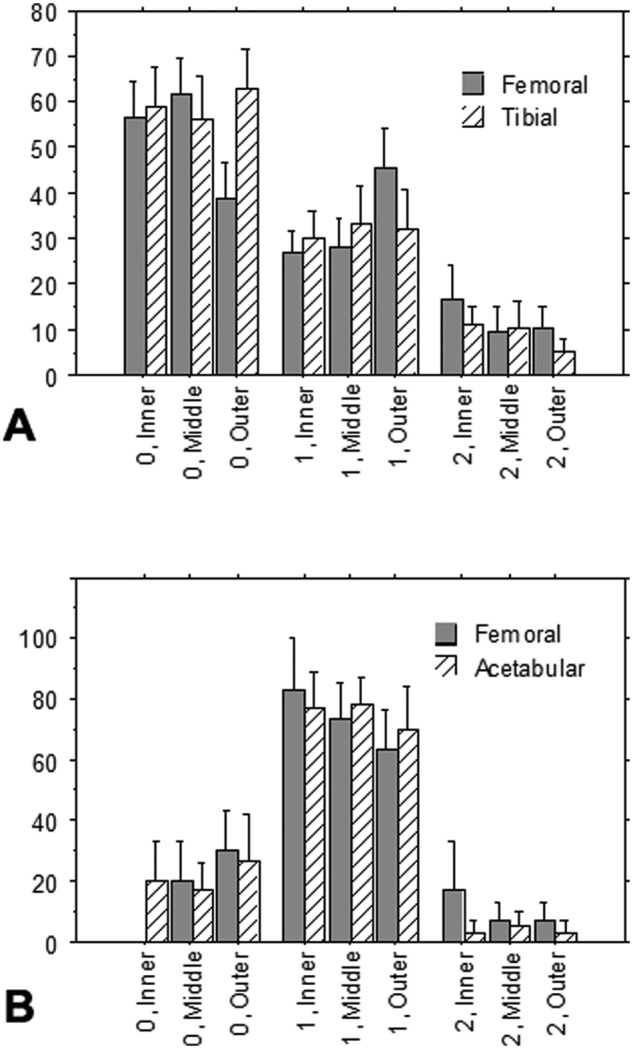
Figure 2.

Graphs showing the percentage of the surface of the (A) menisci (n = 18) and (B) labra (n = 6) displaying degeneration graded 0, + (1), and ++ (2) in the inner, middle, and outer segments on the sides of the samples facing the femur and tibia or acetabulum. Mean ± standard error of the mean.
