
Figure 3.
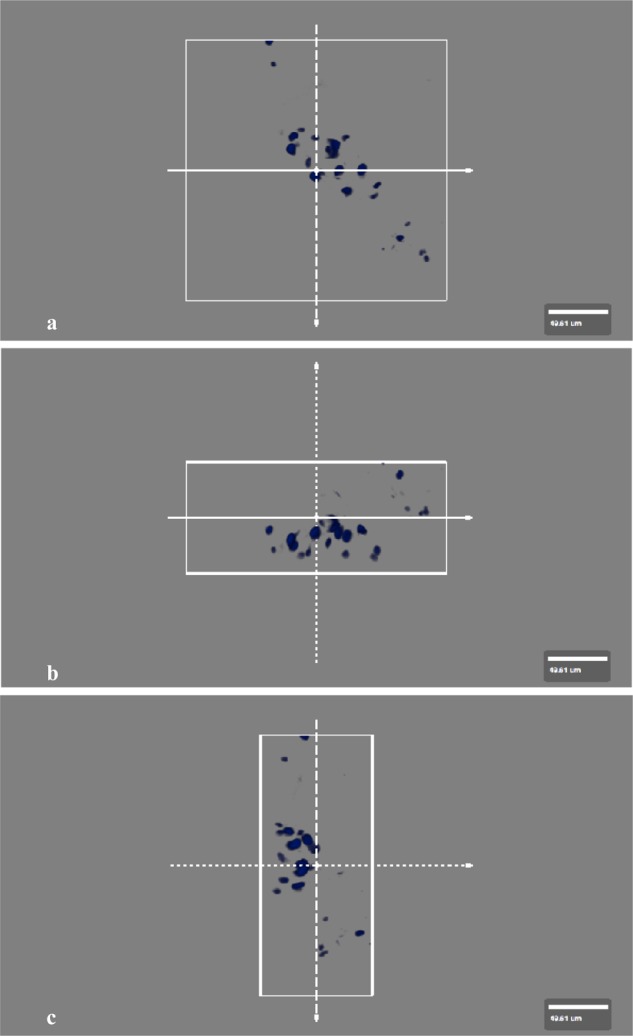
Representative BioView images used to assess 3-dimensional chondrocyte distribution patterns. (A) The x-y plot, (B) the x-z plot, and (C) the y-z plot. Solid, dotted, and dashed lines with arrows reflect coordinate orientation between the images displayed.