
Figure 4.
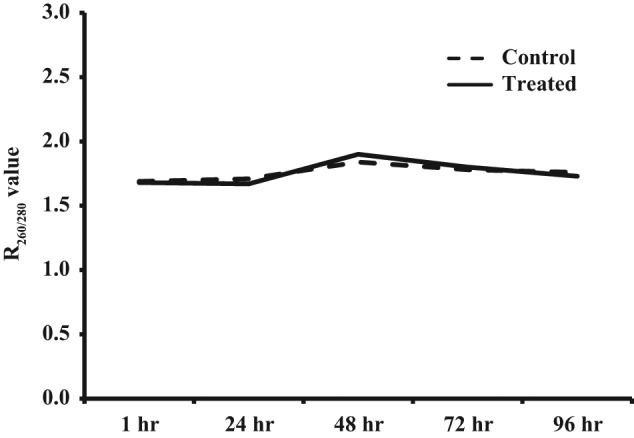
R260/280 values versus time. Note the stability of RNA sample purity produced during the testing period for each incubation interval.
Official websites use .gov
A
.gov website belongs to an official
government organization in the United States.
Secure .gov websites use HTTPS
A lock (
) or https:// means you've safely
connected to the .gov website. Share sensitive
information only on official, secure websites.
R260/280 values versus time. Note the stability of RNA sample purity produced during the testing period for each incubation interval.