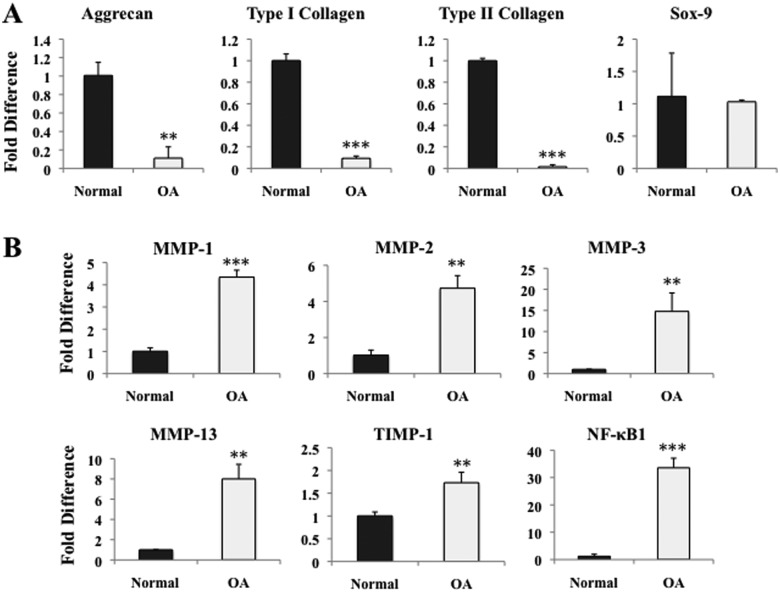
Figure 2.
Real-time PCR of human chondrocytes cultured in vitro for 3 weeks in PEGDA and CGMT, comparing various gene markers between normal and diseased chondrocytes (n = 3). *P < 0.05, **P < 0.01, and ***P < 0.001. (A) Aggrecan, type I collagen, and type II collagen were significantly down-regulated in OA chondrocytes. No significant change was observed in Sox-9. (B) MMPs -1, -2, -3, and -13, TIMP-1, and proinflammatory marker NF-κB1 all up-regulated in OA chondrocytes.

