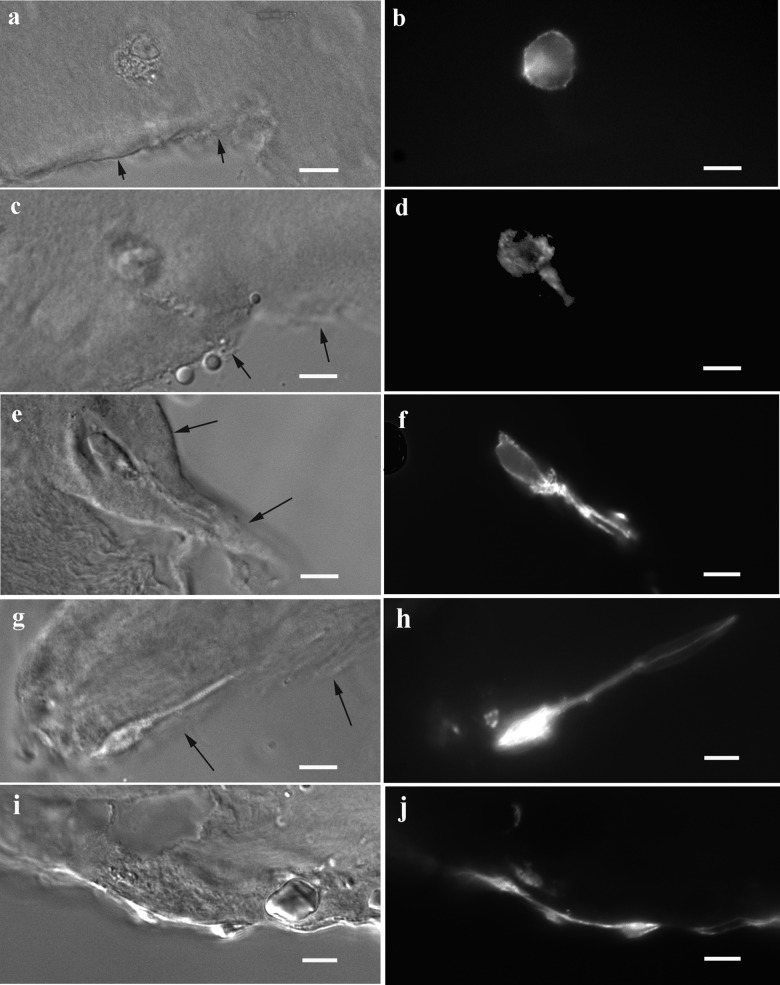
Figure 3.
Cell processes contain actin as demonstrated by phalloidin labeling. Images show the increasing length over time of actin-containing cellular extensions toward the defect in the superficial zone. Images were obtained on day 0 (A, B), 3 (C, D), 7 (E, F), 14 (G, H), and 28 (I, J). Note in D that the cell process, as seen in this section, is approximately equal in length to the cell body after 3 days of culture, while the pseudopods shown in F and H are 2 to 4 times the observed body length at 7 to 14 days. Arrows indicate edges of defects in the DIC images. Bar = 10 µm.

