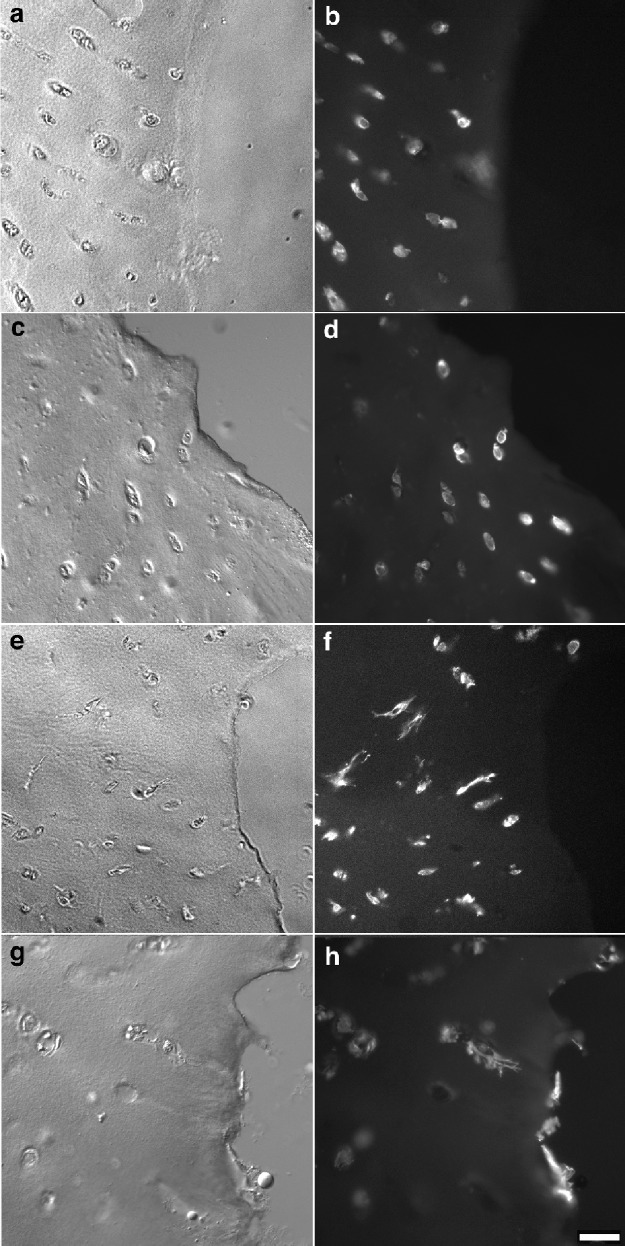
Figure 4.
Low magnification images of the superficial zone of defect edges demonstrating the orientation and number of cellular extensions with time. Phalloidin labeling for actin at day 0 (A, B), 7 (C, D), 14 (E, F), and 28 (G, H) shows the adjacent chondrocytes extending cell processes toward the edge of the defect over time. By 4 weeks, resurfacing of the defect edge has occurred. Bar = 30 µm.

