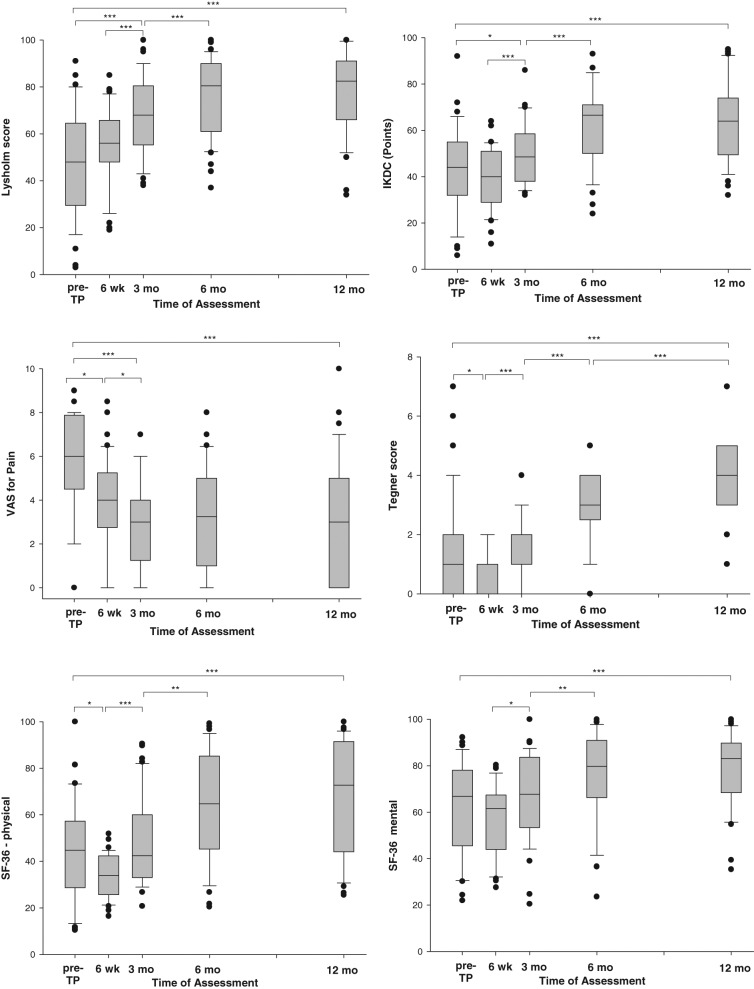
Figure 2.
Changes in the self-administered assessment scores from the day before ACT3D (baseline) to the final assessment at 12 months. The boxes indicate the 25th and 75th percentiles; the error bars (whiskers) indicate the 10th and 90th percentiles. The bullet points mark the outlying values. wk = weeks; mo = months; pre-TP = day before transplantation. *P < 0.05. **P < 0.001. ***P < 0.0001.

