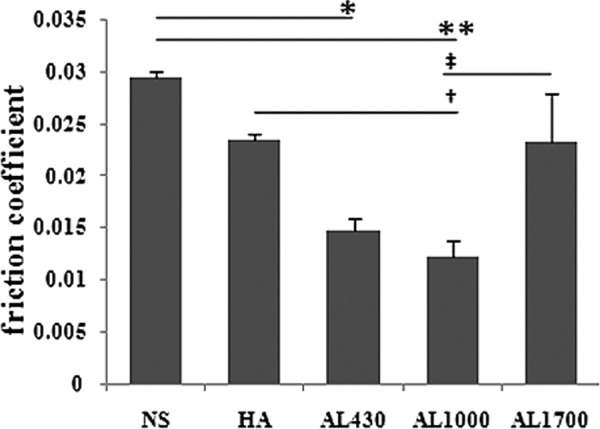
Figure 4.

Results of the pendulum friction test. Values are the mean ± standard error (SE) friction coefficients. *P < 0.01 versus the normal saline (NS) group. **P < 0.005 versus the NS group. †P < 0.05 versus the hyaluronan (HA) group. ‡P < 0.05 versus the AL1700 group.
