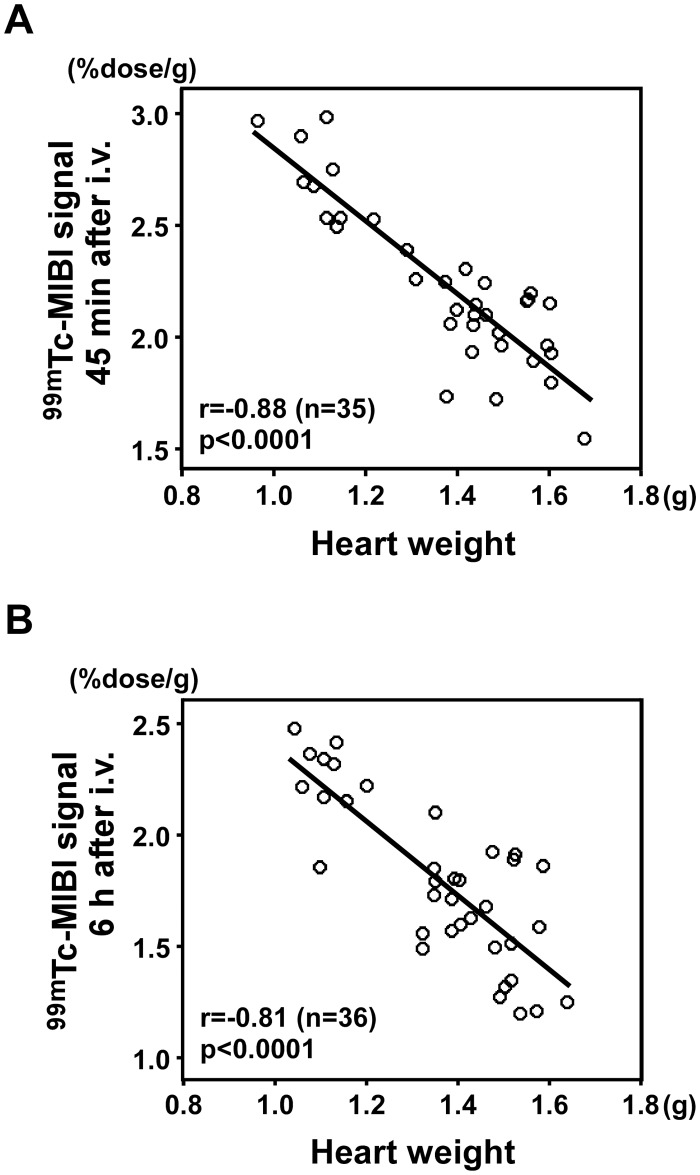
Figure 6. Correlation between 99mTc-MIBI signals and heart weight.
(A) 99mTc-MIBI signal per gram of heart tissue 45 min after the injection was inversely correlated with heart weight (r = -0.88, n = 35, P < 0.0001). (B) 99mTc-MIBI signal per gram of tissue 6 h after the injection inversely correlated with heart weight (r = -0.81, n = 36, P < 0.0001).

