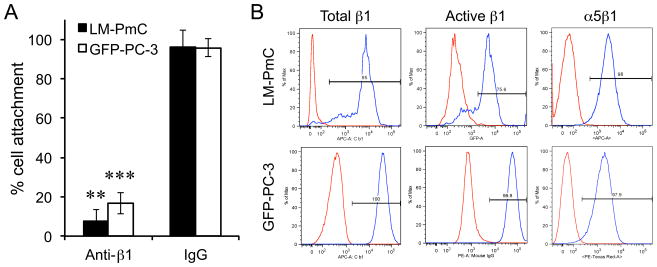
Figure 5. β1 integrin-dependent tumor cell attachment to fibronectin.
A, LM-PmC (closed bars) or GFP-PC-3 (open bars) cells were seeded into 96-well plates coated with fibronectin, and allowed to attach for 30 minutes at 37°C in the presence of an anti-β1 integrin subunit antibody or a control IgG. The number of cells that remained attached to the wells were quantified. Cell attachment with no antibody was considered as 100%. n = 3. Error bars denote mean ± SEM. Statistical analyses were performed with Student’s t-test: **P < 0.01; ***P < 0.001. B, Expression of total β1 integrins, β1 integrins in active conformation, and α5β1 integrin in LM-PmC and GFP-PC-3 cells analyzed by flow cytometry. The profiles represent the values of cells incubated with isotype control (red) or appropriate anti-β1, anti-active β1, or anti-α5β1 primary antibodies (blue).

