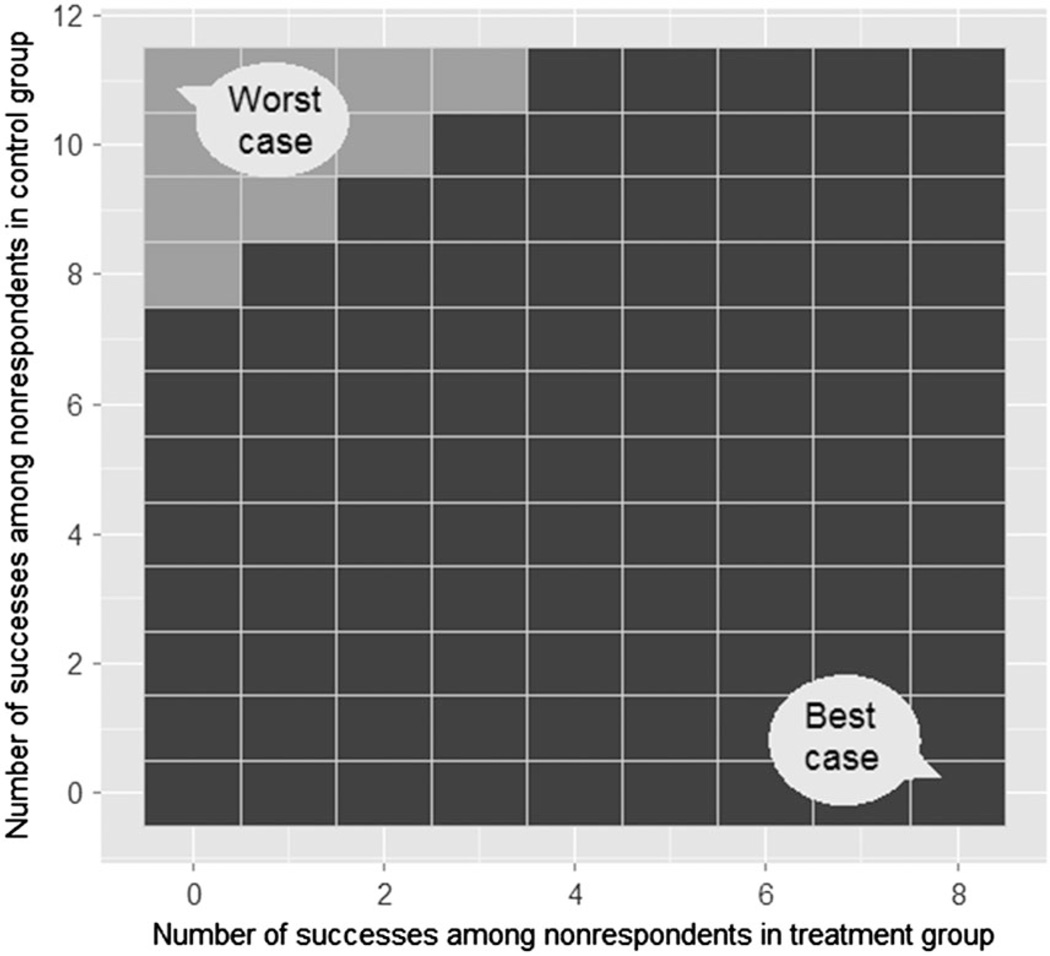
Figure 1.
Basic tipping-point display proposed in [48]. The horizontal and vertical axes indicate the number of successes that can potentially be observed among nonrespondents in the treatment group and the control group. Each combination is marked as either ‘altering the study’s conclusion’ (lighter squares) or ‘keeping the study’s conclusion unchanged’ (darker squares). The staircase region indicates the tipping points of the study.

