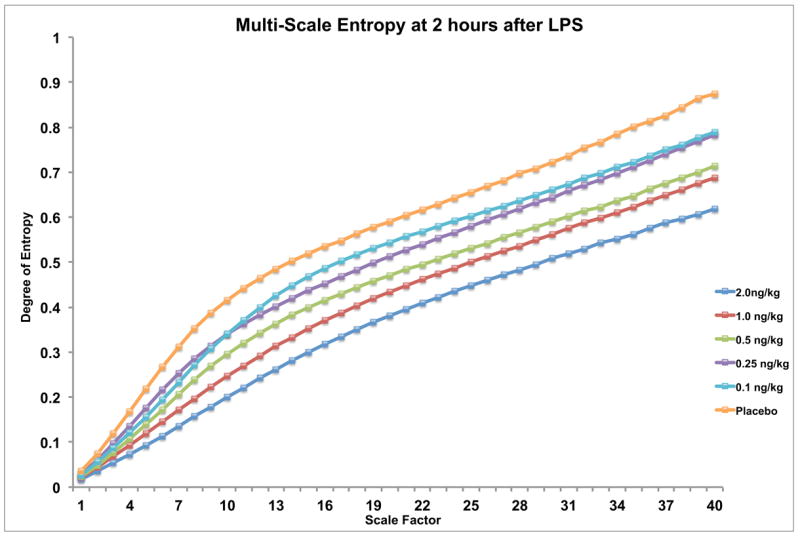
Figure 4.

Multi-scale entropy of heart rate variability at 2 hours after endotoxin administration in human volunteers. By applying repeated-measures ANOVA using scale factor as the dependent variable and endotoxin dose as the independent variable, significant decreases in entropy are seen at 2 hours in subjects receiving the 1 and 2 ng/kg doses (p<0.05). Interestingly, while not statistically significant at the lower doses, the figure suggests a regular dose-response pattern proportional to endotoxin concentration which continues smoothly through even the lowest dose (0.1 ng/kg). This contrasts with the threshold-dose effect seen in other outcomes in Figs. 1-3, where clear patterns are rarely evident below the dose required for significance.
